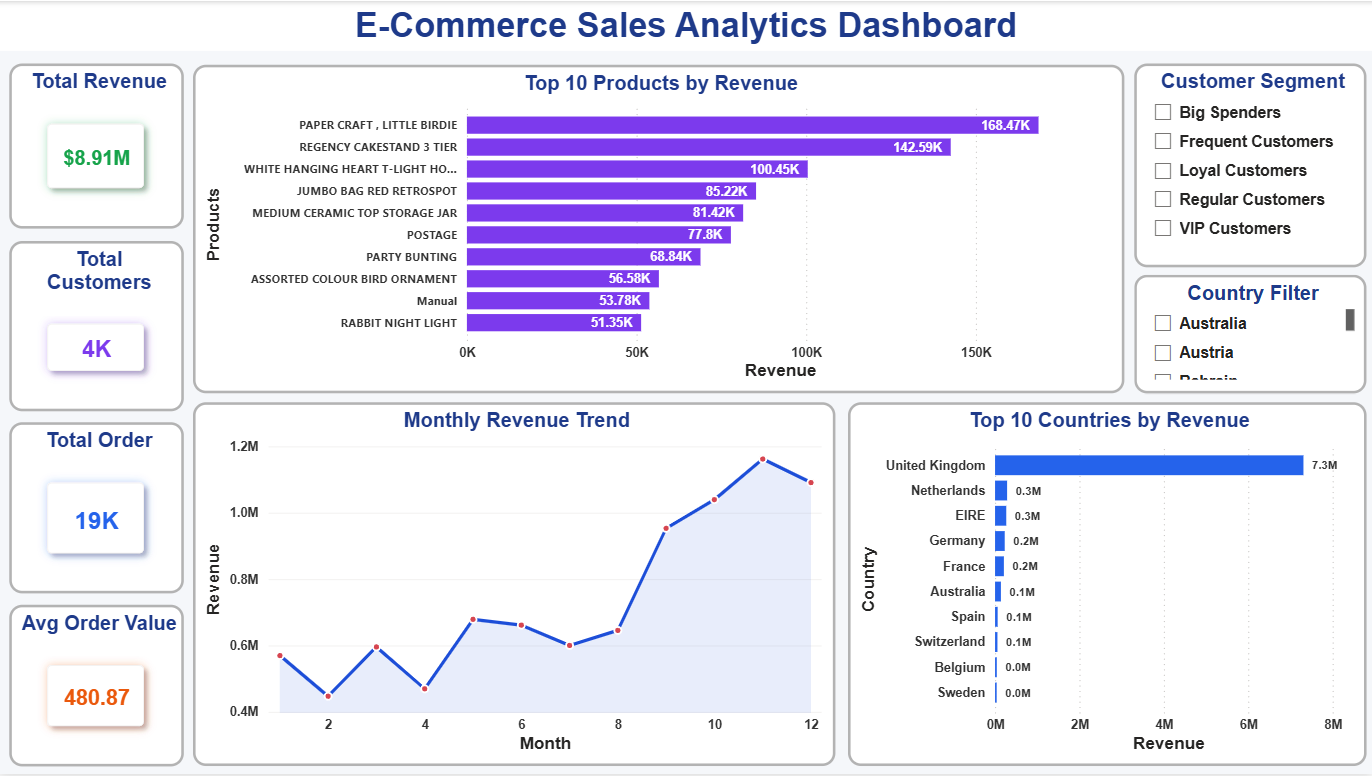
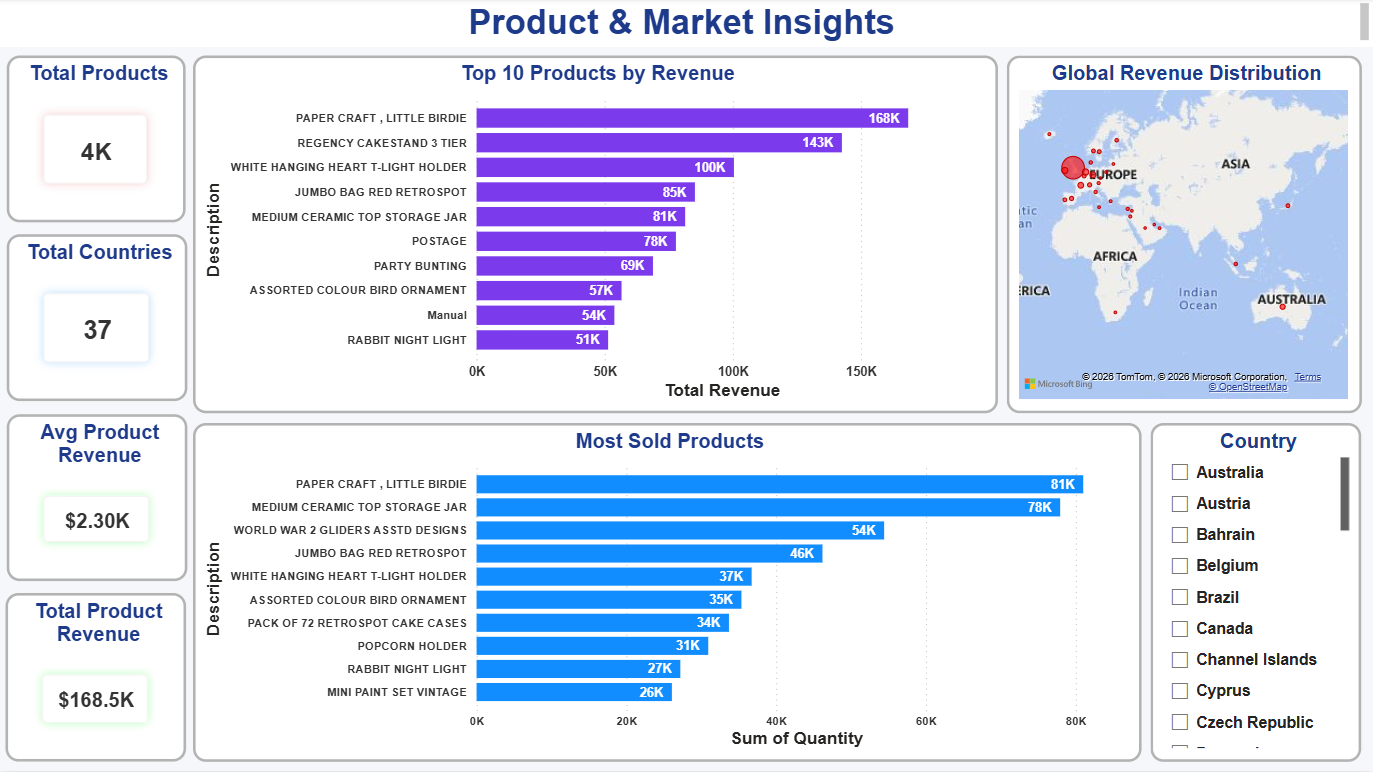
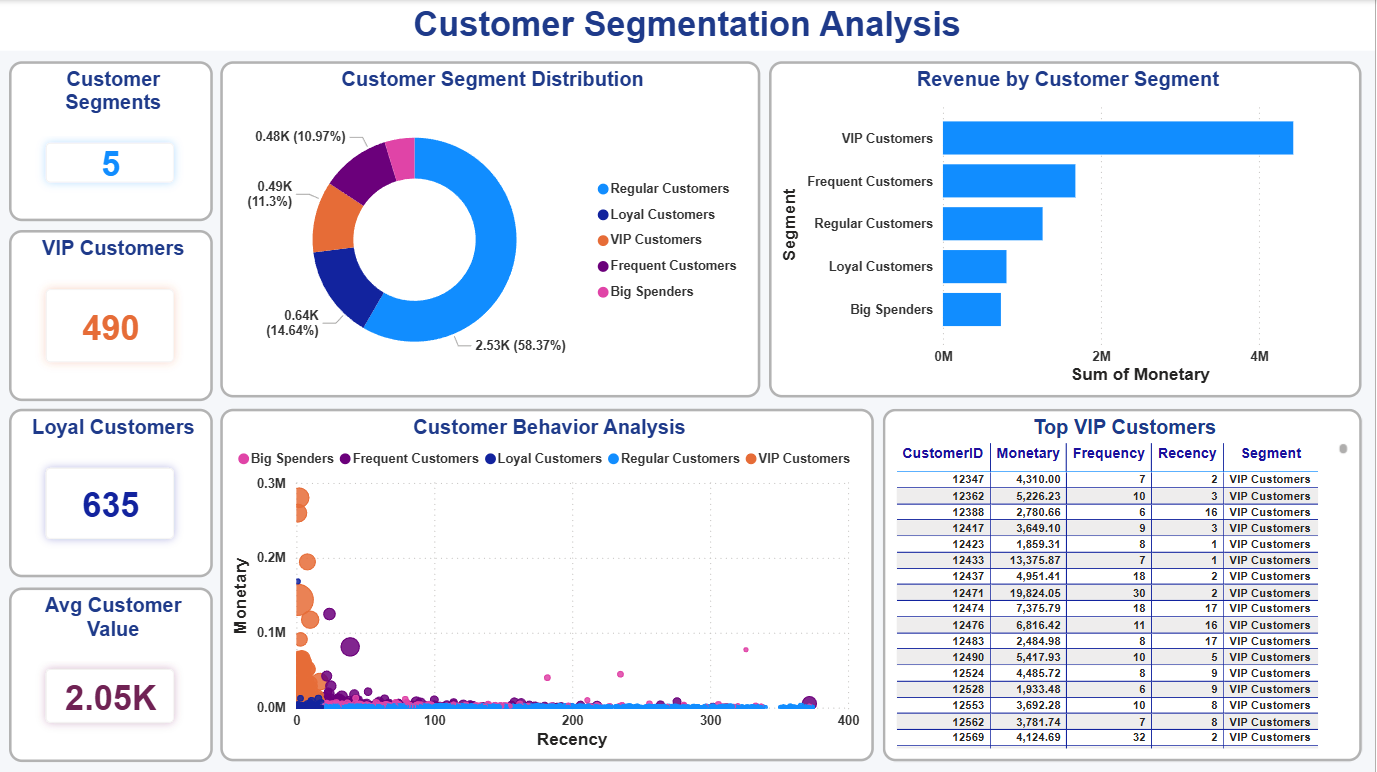
An end-to-end ecommerce analytics project built using Python, SQL and Power BI to analyze customer behavior, sales performance, revenue trends and business KPIs. The project delivers interactive dashboards and actionable insights to support data-driven business decisions.
Ecommerce businesses generate thousands of transactions every day, making it difficult to identify purchasing patterns, high-value customers and sales opportunities. This project analyzes customer behavior, product performance, regional sales and revenue trends to provide business insights through interactive dashboards.
Collected ecommerce transaction data including customers, orders, products and payments from multiple tables for business analysis.
Removed duplicates, handled missing values, standardized product names and prepared clean datasets using Python.
Used SQL to analyze revenue, customer behaviour, sales trends and product performance.
Designed an interactive Power BI dashboard with KPIs, customer segmentation, sales trends and business insights.
Total Revenue
Customers
Total Orders
Countries
Revenue steadily increased over time with significant spikes during promotional campaigns.
A small percentage of loyal customers contributed a major share of total revenue.
Technology products generated the highest revenue while office supplies maintained consistent sales throughout the year.
Increase marketing efforts for high-value customers and optimize inventory for top-selling products.
Explore the complete project repository including Python analysis, SQL scripts, Power BI dashboard and business recommendations.