End-to-end retail sales analytics project built using Python, SQL, Power BI and Tableau to uncover business insights, forecast future sales and support strategic decision-making.
Retail businesses generate massive sales data every day. Without proper analytics, identifying customer trends, regional performance and future demand becomes difficult. This project helps decision-makers monitor KPIs, forecast sales and improve profitability.
Imported retail sales dataset from Walmart transaction records and prepared it for analysis.
Removed duplicates, handled missing values, standardized columns and validated data quality using Python.
Wrote SQL queries to analyze sales, customer behaviour, product performance and regional trends.
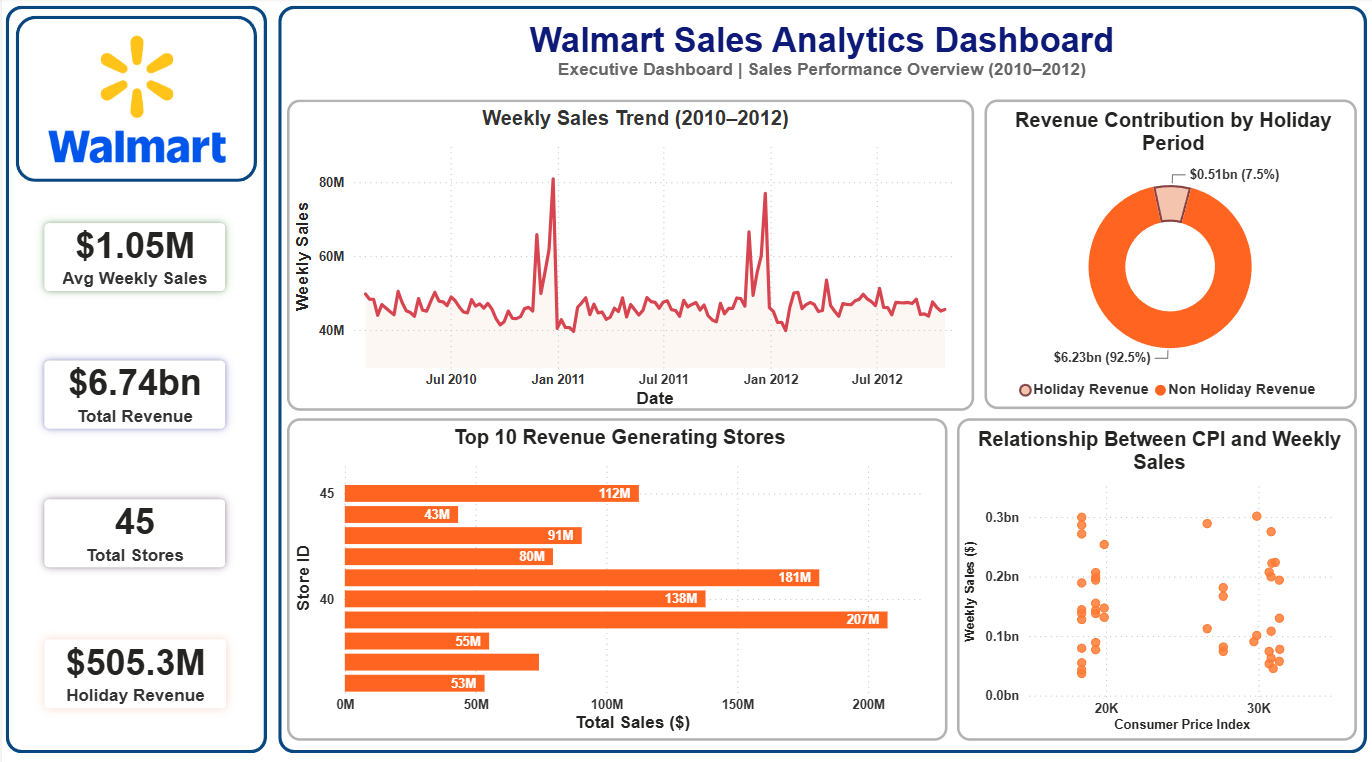
Built interactive Power BI and Tableau dashboards for business stakeholders.
Total Sales
Total Profit
Total Orders
Customers
Sales showed strong seasonal growth with peak performance during the holiday period.
Western region generated the highest revenue, while South had the fastest growth rate.
Electronics contributed the highest share of overall revenue and profitability.
Improve inventory planning and increase promotions for high-performing categories.
View the complete source code, dashboard, SQL queries and documentation on GitHub.